
As the UK accelerates its journey towards net zero, the Future Energy Scenarios (FES) 2025 report from National Energy System Operator (NESO) offers a timely and strategic lens into possible pathways that are likely to shape Great Britain’s (GB) future energy landscape. It is the first FES published since NESO was established in October 2024 as an independent public corporation, previously operated by National Grid. NESO is responsible for ensuring a secure, reliable, and efficient energy system in GB.
A key evolution from FES 2024 is the introduction of four distinct waves of transformation, namely, Foundation, Acceleration, Growth, and Horizon (Figure 1). Each representing a possible phase in GBs net zero transition. FES 2025 acknowledges that the Foundation years are already behind us, with much of the groundwork laid through the development of key low carbon technologies. The critical enablers for success fall within four main areas, namely energy efficiency, demand flexibility, infrastructure and energy supply and switching to low carbon technologies. With the Clean Power 2030 Action Plan setting a clear benchmark, the report makes one thing clear:
“Delivering a clean power system in 2030 is an important milestone but there remains a great deal to do. The next few years are critical, both in making progress and in preparing for the waves to come.”
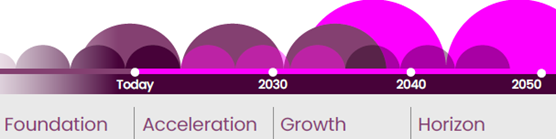
Figure 1: Four Distinct Waves (FES 2025)
FES 2025 makes clear that urgent action is needed to achieve decarbonisation across the board. Here are some of the main insights from the report:
- Falling Behind and not Counterfactual: The pathway previously referred to as Counterfactual in FES 2024 (previously named as Falling Short in FES 2023 and FES 2024) has been named Falling Behind. This pathway is the only pathway which does not reach net zero by 2050, highlighting the risks of delayed action.
Alongside the 2050 pathways, NESO produce a Ten-Year Forecast (10YF). It represents their current view of the next ten years, taking account of where we are today
- Nationally Determined Contribution (NDCs) – Only One Pathway Delivers: Under the Paris Agreement, countries submit Nationally Determined Contributions (NDCs) climate targets that guide national efforts to reduce greenhouse gas emissions. While not legally binding, NDCs serve as important benchmark for progress. For the UK, the targets are a 68% reduction by 2030 and 81% by 2035, compared to 1990 levels. Only the Holistic Transition pathway meets both targets.
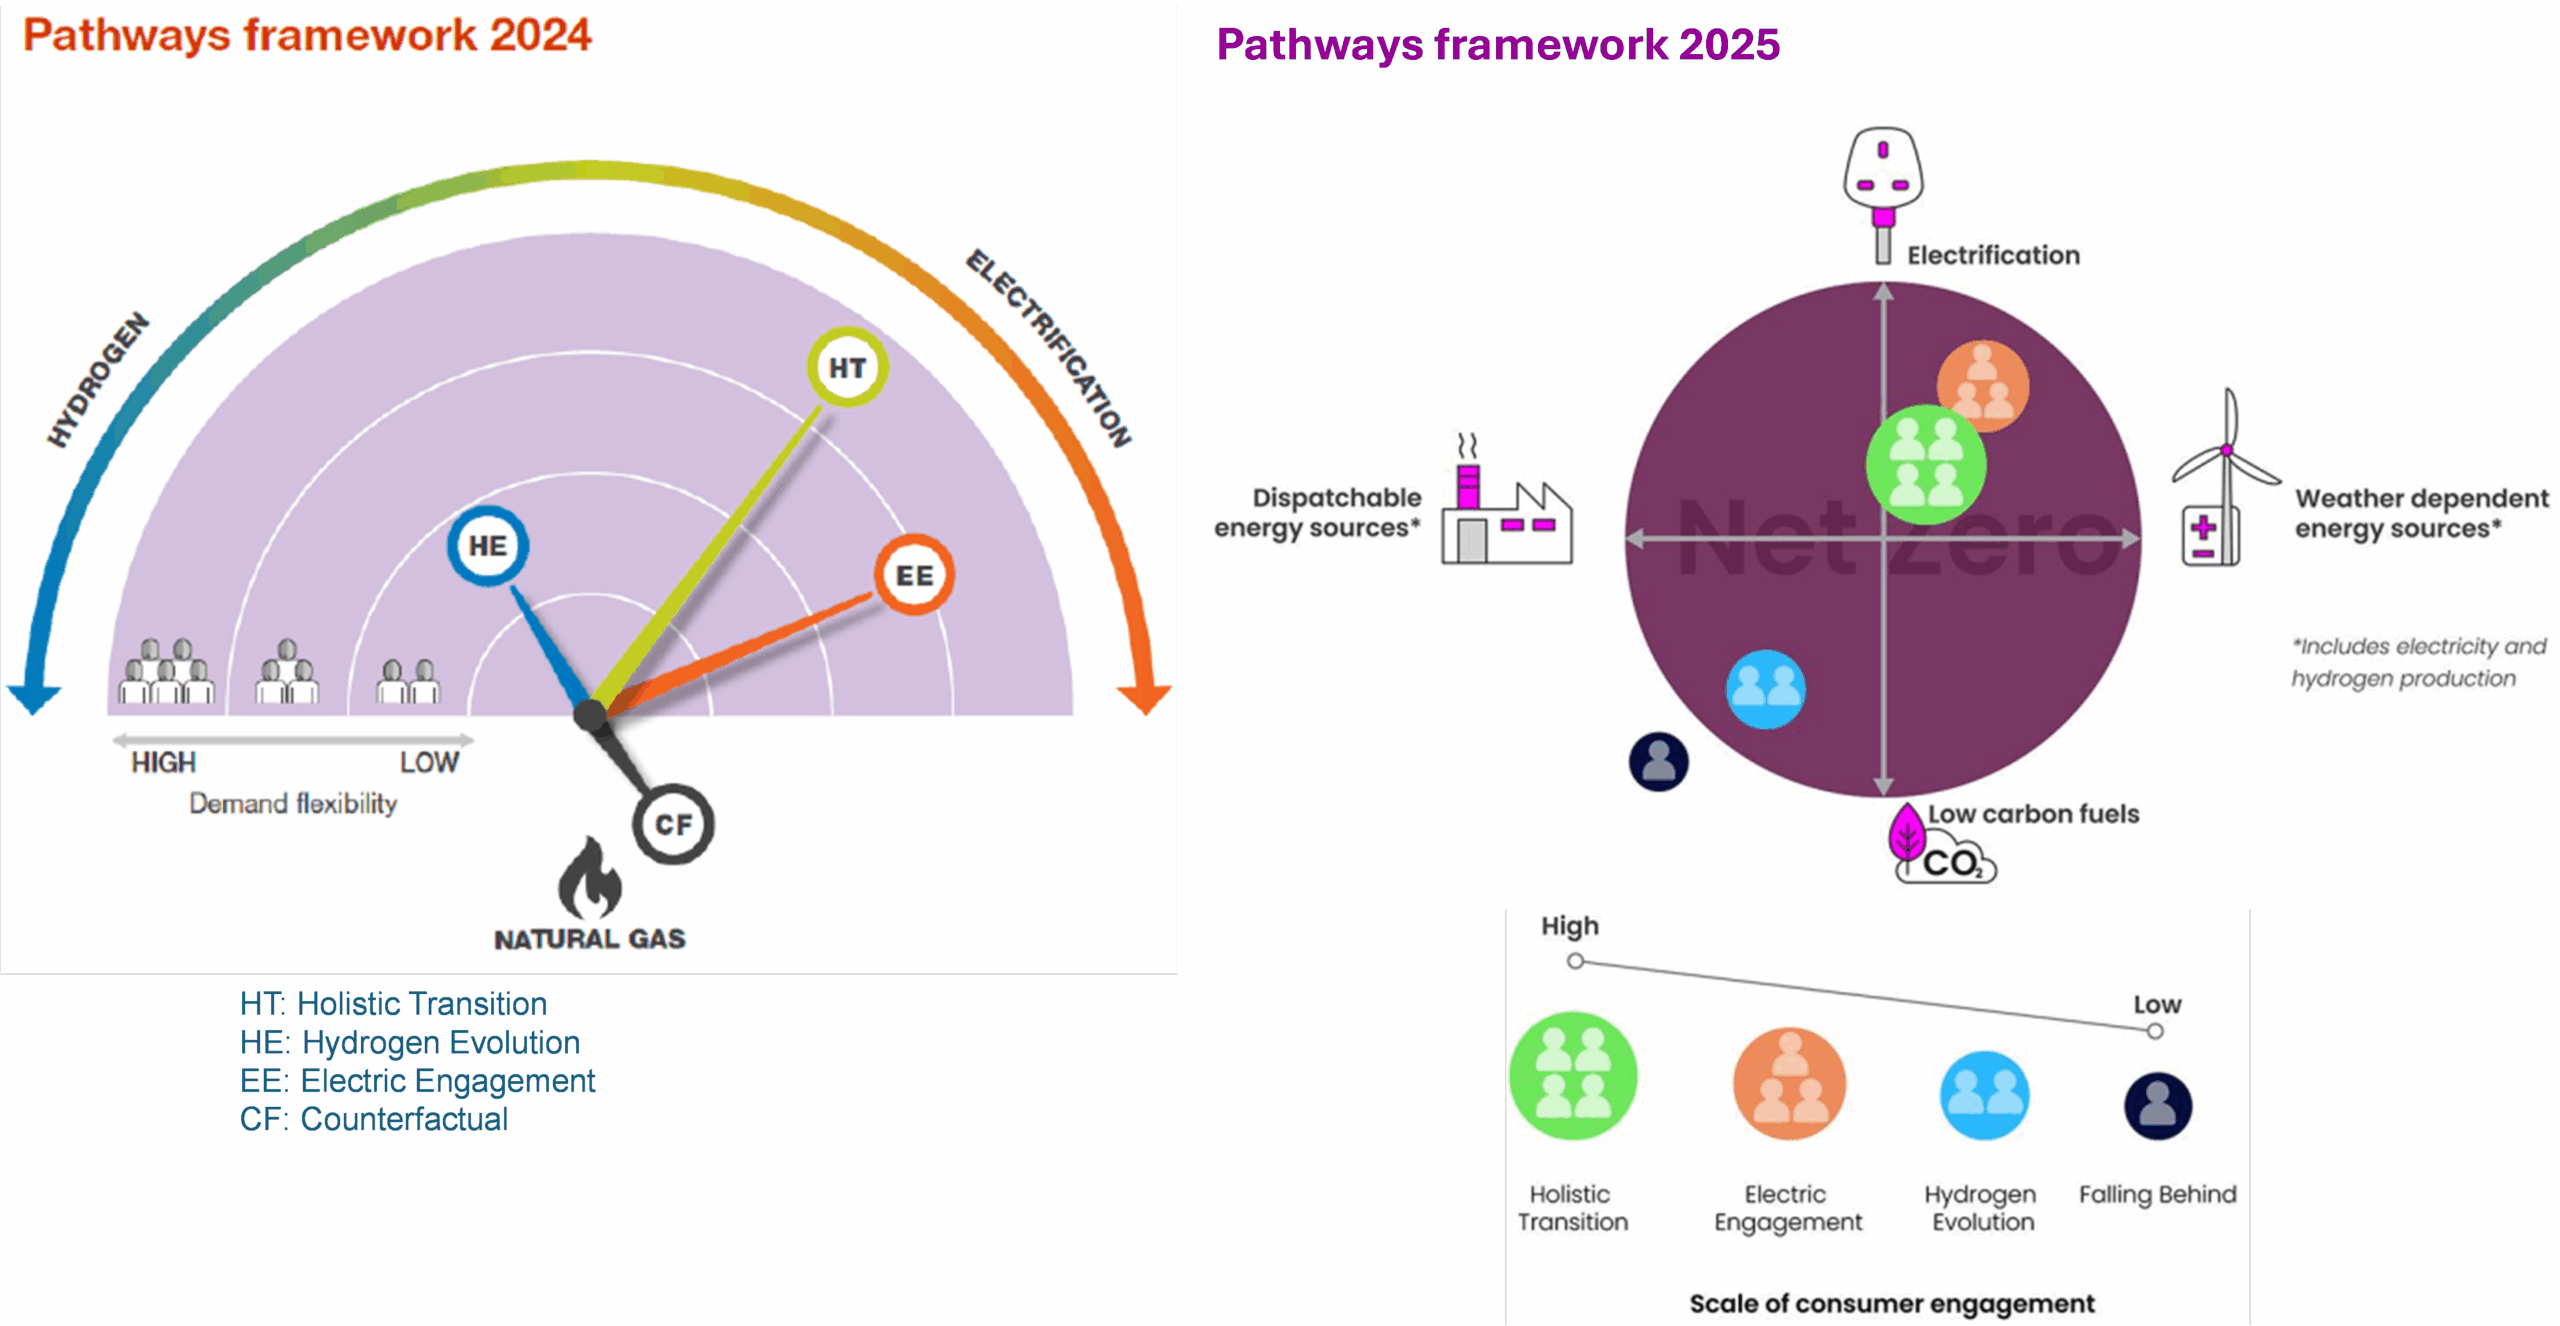
- A New Lens on Pathways: The representation of pathways has evolved from the hydrogen, electrification and natural gas matrix used in FES 2024 to a more integrated quadrant-based framework (Figure 2). Crucially, this framework also integrates consumer engagement as a central dimension, recognising that consumer led behavioural change, participation in demand flexibility, and technology adoption are essential to delivering net zero.
- Transport transformation: The UK’s Zero Emission Vehicles (ZEV) mandate is accelerating decarbonisation across the transport sector. All net zero pathways project 100% zero-emission car sales from 2030, with the Falling Behind scenario diverging—yet still anticipating a higher number of zero-emission vehicles by 2050. This is largely due to the reduced car ownership assumptions considered in other pathways, where modal shifts toward car sharing and public transport are more prominent. Vans are closely following, supported by evidence from today – 52% of new van models were battery-electric at the start of 2025. Buses are expected to decarbonise faster than other non-car vehicle types, while heavy goods vehicles (HGVs) are beginning to transition, with most stakeholders favouring battery-electric over hydrogen.
- Continued importance of BECCS: Bioenergy with carbon capture and storage for electricity generation (power BECCS) will play an important role. NESO assumes conversion of biomass to BECCS beginning by 2030 in all pathways.
- Long-term dependence on Nuclear Power: FES 2025 highlights the continued importance of nuclear power in achieving a clean energy system through 2030 and beyond. Small modular reactors (SMRs) represent 39–59% of all installed nuclear capacity by 2050. Recent developments including final investment approval for Sizewell C and the selection of Rolls-Royce as the preferred bidder for the UK’s first SMR, demonstrate that nuclear will remain a key part of the UK’s energy mix.
- Hydrogen future: FES 2025 pathways primarily associate hydrogen production via electrolysis and methane reforming with CCS. Rapid adoption of hydrogen in industry (enabled by a national hydrogen network) is seen vital for net zero, though most heating at homes remains electrified. Hydrogen is projected to be used for some heavy goods vehicles, but electric vehicles remain the dominant choice. By 2050, industry, power generation, and aviation are the primary consumers of hydrogen. Reflecting ongoing uncertainty around long-term supply, FES 2025 forecasts lower hydrogen demand than FES 2024.
- Data centres reshaping energy use: Electricity demand from data centres is expected to rise significantly, driven by the growth of AI and digital services. FES 2025 estimates current electricity demand at 7.6 TWh, primarily from facilities largely supporting traditional sectors like banking. However, future data centres are projected to be increasingly AI-driven, with less emphasis on location and latency. The UK Government’s launch of the AI Opportunities Action Plan signals strong ambition in this space. All net zero scenarios anticipate a seven- to nine-fold (7x to 9x) increase in data centre electricity demand by 2050 relative to today.
- Important role of energy efficiency: Energy efficiency measures remain fundamental to managing the projected growth in electricity demand. In the Holistic Transition pathway, enhancements to the efficiency of buildings and appliances could lead to an 18% reduction in electricity demand by 2050. Key improvements include better insulation, widespread adoption of heat pumps and advances in their efficiency, the use of LEDs, more efficient appliances, and gains in electric vehicle efficiency. For all net zero pathways, from 2027, heat pumps and low-carbon district heating become the only heating options permitted for new homes, while the installation of new fossil fuel boilers is phased out entirely from 2035.
- Demand flexibility to drive peak reductions: FES 2025 highlights the critical role of demand flexibility in reducing peak electricity demand and minimising the need for new supply infrastructure. In the Holistic Transition pathway, households and businesses could cut peak demand by up to 54% by 2050. Smart charging is projected to shift 83% of EV peak demand, while heat pumps could shift 36% of their associated peak. Electric vehicles are expected to be the largest source of flexibility, providing up to 51GW of peak flexibility.
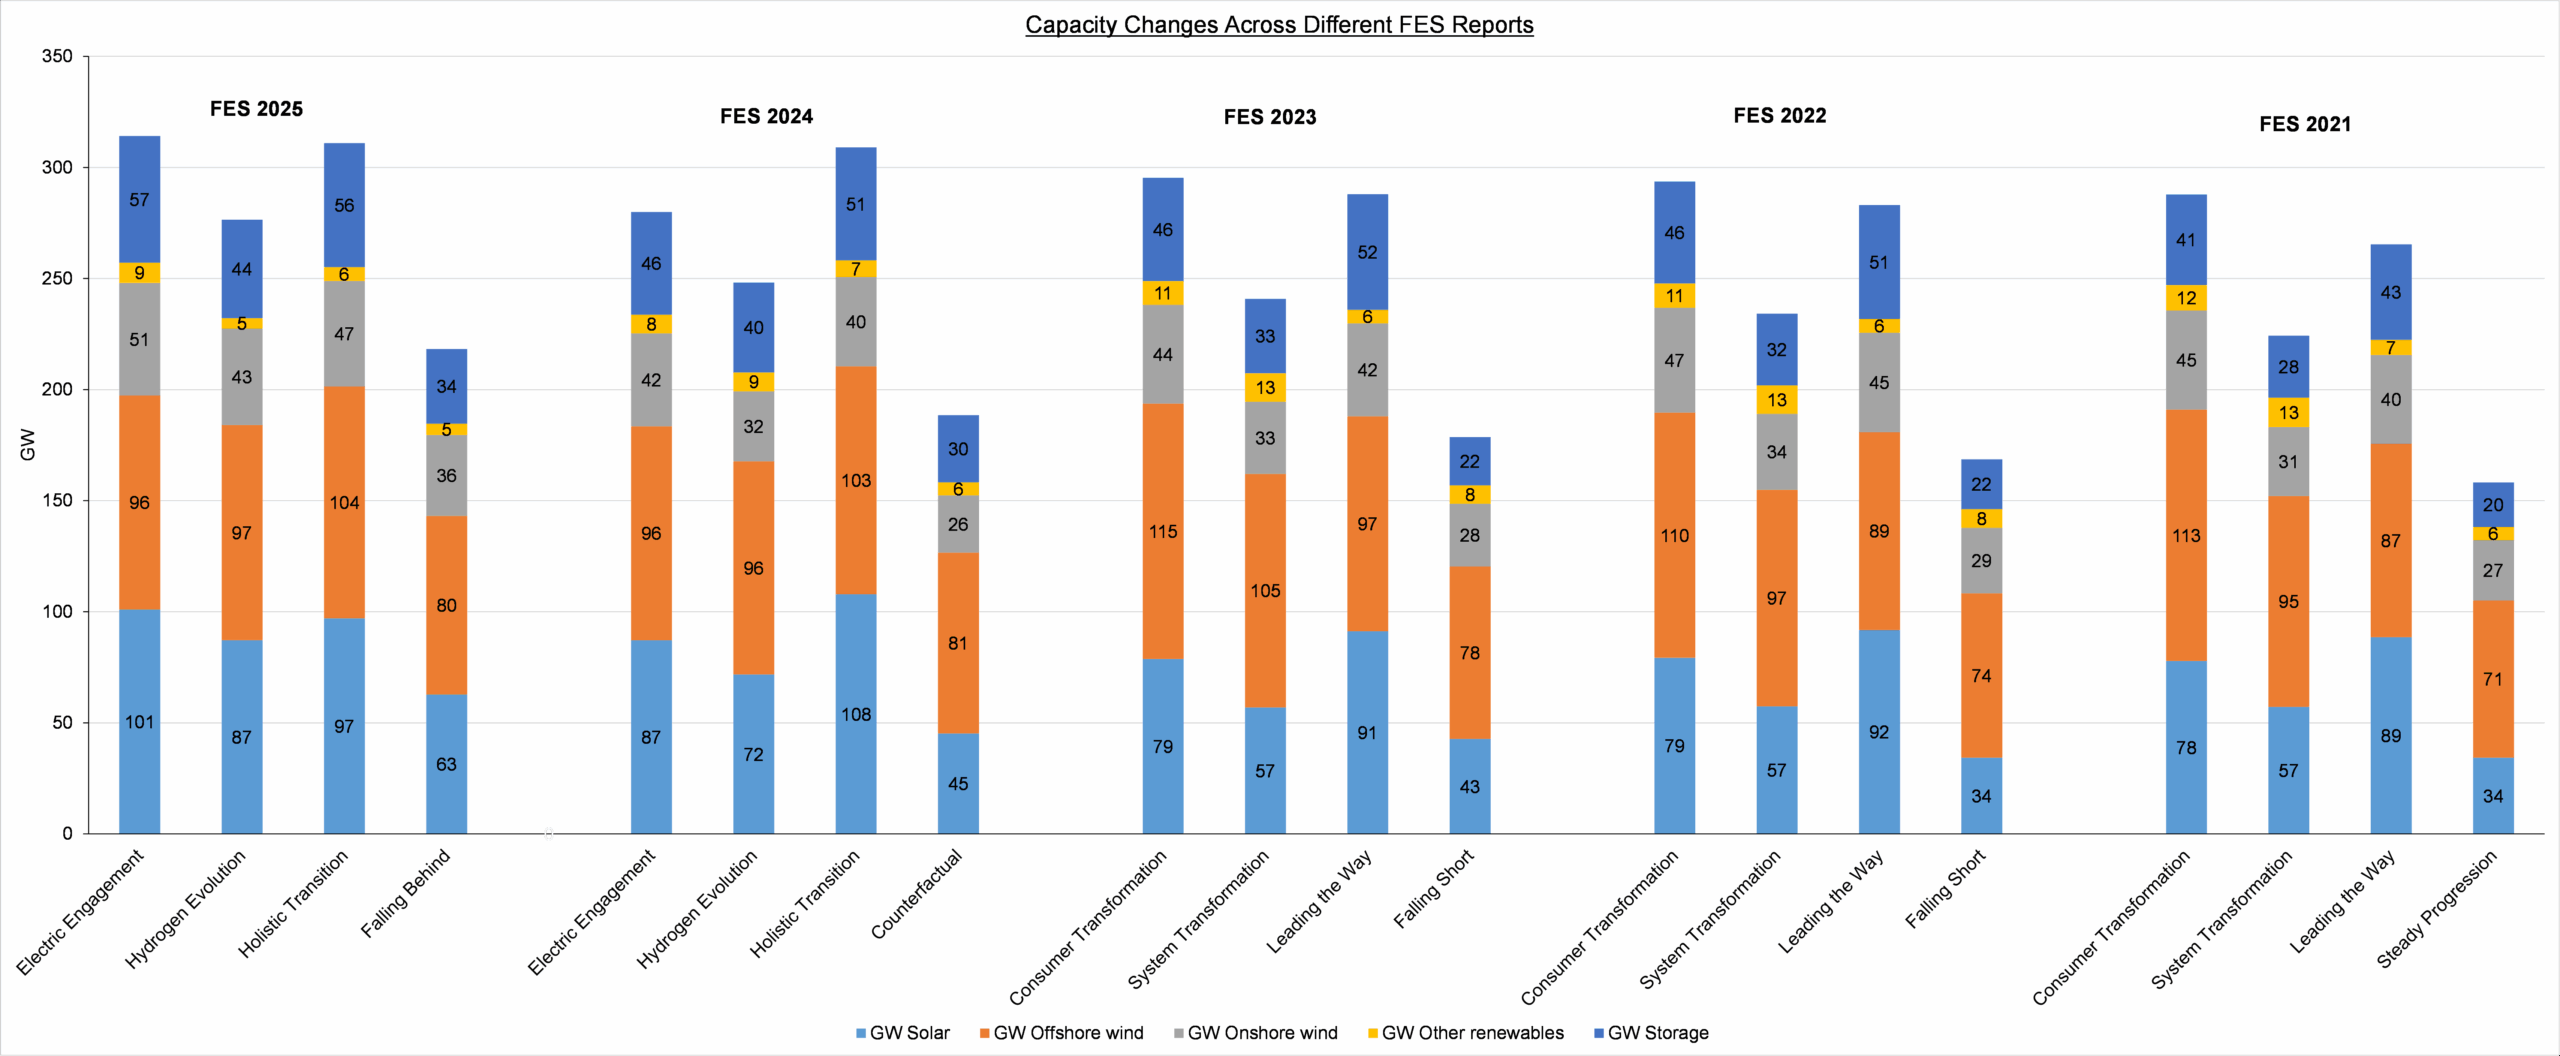
- Renewable Energy and Storage Capacities: The capacity predictions for renewable energy and storage have evolved. Above is a comparison of offshore wind, onshore wind, other renewables, and storage capacities across FES 2021 to FES 2025. Solar PV (in most pathways) and onshore wind (in all pathways) have seen the most significant capacity increases in FES 2025 closely followed by storage, whilst NESO has refined projections for other renewables and adjusted adoption rates to more realistic and practical levels.
In conclusion, FES 2025 sets out possible pathways for accelerating GBs energy transition. It highlights the opportunities ahead, from scaling clean power and storage to unlocking flexibility and improving efficiency. These next few years will be pivotal, not just in meeting targets, but in shaping a more sustainable, secure, and inclusive energy system.
At Tetra Tech, we are proud to support this journey. Whether it is helping to decarbonise buildings, enable demand-side flexibility, or advance zero-emission transport, we are working alongside clients to turn vision into action. Together, we can accelerate the energy transition and shape a future that’s sustainable for you and the wider society.
Connect with us. Reach out to our experts.